Figure 1: CNR per unit time vs k-space location for optimized sequence.
The sequences were optimized with the help of a Bloch equation simulator
written for Matlab. Five base sequences were selected and each of
these was optimized for the maximum minimum contrast-to-noise ratio
difference per unit time between white matter and gray matter and gray
matter and CSF across k-space. Note that the flatness of the response
across k-space was not considered. The properties of the five base
sequences are listed in Table 1 below.
Table 1: Properties of base sequences.
| Seq. no. | Sequence description | TR | Read-out time | TE |
| 1 | Original Sonata MP-RAGE | 11.08 ms | 7680 us | 4.3 ms |
| 2 | Above matched to Vision | 9.7 ms | 5120 us | 4.1 ms |
| 3 | Above with improved gradients | 7.25 ms | 5120 us | 3.0 ms |
| 4 | Above with shorter read-out | 4.65 ms | 2560 us | 1.9 ms |
| 5 | Allegra MP-RAGE | 6.6 ms | 3584 us | 2.9 ms |
The optima were found assuming a sagittal slice orientation, 128 partitions and a matrix size of 192 x 256. The results for each base sequence are listed in Tables 2 and 3.
Table 2: Optimal protocol parameters for each base sequence on 1.5 T Siemens Sonata.
| Seq. no. | CNR | FA | TI | TD |
| 1 | 0.0061 | 7 | 300 | 1000 |
| 2 | 0.0055 | 7 | 350 | 1200 |
| 3 | 0.0064 | 7 | 400 | 1200 |
| 4 | 0.0050 | 5 | 400 | 3200 |
| 5 | 0.0054 | 7 | 450 | 1400 |
Table 3: Optimal protocol parameters for each base sequence on 3 T Siemens Allegra.
| Seq. no. | CNR | FA | TI | TD |
| 1 | 0.0042 | 7 | 300 | 1000 |
| 2 | 0.0037 | 7 | 350 | 1200 |
| 3 | 0.0042 | 7 | 400 | 1200 |
| 4 | 0.0049* | 5 | 400 | 3200 |
| 5 | 0.0036 | 7 | 450 | 1400 |
*Although the best CNR per unit time for the Allegra is 0.0049 using the 2560 us read-out, this optimum is not chosen because gray matter intensity exceeds white matter intensity for this choice of parameters. While the white-gray-CSF contrast is greatest under these conditions, inverted contrast is inappropriate for the reconstruction software. For both the 1.5 T Siemens Sonata and the 3 T Siemens Allegra, sequence 3 is chosen with the corresponding parameters listed in the tables above.
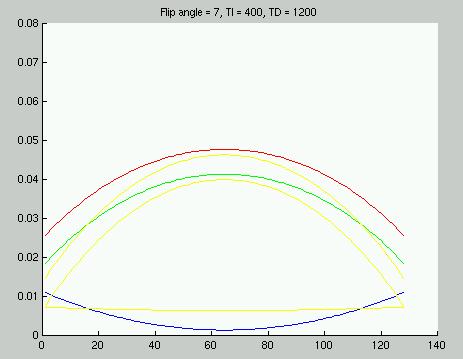
Shown below are four figures illustrating the differences between the optimal sequence and some close-to-optimal variations in the 1.5 T case. The figures show the CNR per unit time for white matter (red), gray matter (green) and CSF (blue). The yellow lines show the 3 combinations of the CNR differences between two of these tissue types.
Figure 1: CNR per unit time vs k-space location for optimized
sequence.
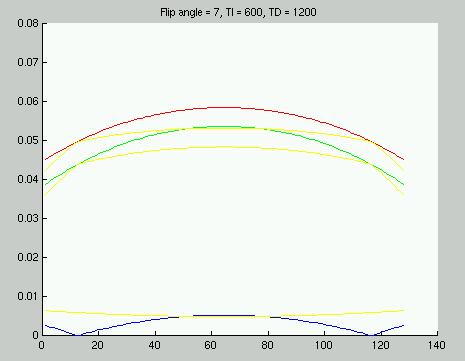
Figure 2: CNR per unit time vs k-space location for sequence
with TI=600 ms. This is the preferred sequence.
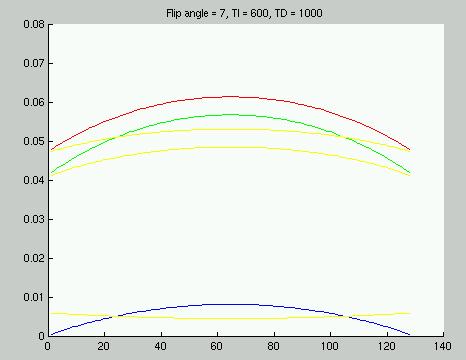
Figure 3: CNR per unit time vs k-space location for TI=600 ms
and TD=1000 ms.
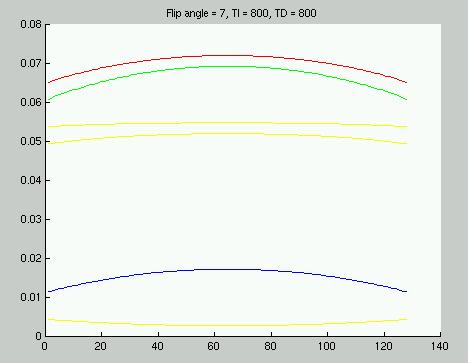
Figure 4: CNR per unit time vs k-space location for TI=800 ms
and TD=800 ms.
Inspecting Figures 1 and 2 reveals that increasing TI shifts the sequence
slightly further from the situation in which the white-gray contrast inverts
at the higher spatial frequencies. If the Vision optima (sequence
2) are tried on a Vision system, it may be prudent to increase the TI slightly.
Even better would be to vary the parameters about the values listed above
and obtain several scans on human subjects before settling on a final sequence.